Sping and Mass
Sping and Mass
OverviewThe drawing below shows a mass on a spring in the Earth's gravitational field. In the left portion the mass is being acted on by two forces which balance each other - the spring and gravity. Because the net force is zero, the mass is said to be in equilibrium. In the right drawing the mass is displaced by a distance x. To make this displacement requires a force given by:
The constant k is called the spring constant of the spring and is measured in units of newtons/meter. This is a so-called restoring force in that the force always acts in such a way as to being the mass back to its equilibrium position.
We will see later that whenever we have a linear (the force depends on the 1st power of x) restoring force, the resulting motion is oscillatory. That is, as a funtion of time:where A is the amplitude (maximum value of magnitude of x) and the Greek delta is the so-called phase - it determined what defines t = 0. We could have used a sine function instead of a cosine function. That would just change the value of delta. The lower case Greek omega is the so-called angular frequency given by:
Object
The idea of this lab is to use a motion detector to record the oscillations of a mass on a spring. Once that data has been gathered, IGOR should be used to fit it to a sine function and extrapolate the spring constant.
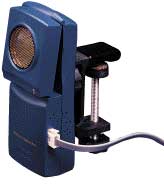
Aside from the spring and weights, the tools needed for this lab are a Vernier LabPro computer interface and a Vernier motion detector; both are available in SW135. The Vernier LabPro interface can be connected to a Macintosh G4 via USB cable. Once the LabPro is plugged in, load the Logger Pro software package (Apple Menu -> Honors Physics -> Logger Pro). From there, it's just a matter of hitting record and starting the oscillation.
You should record as many oscillations of the spring as the software will allow, to improve the quality of the curve fit. Also, try several different masses on the same spring, to see how the mass affects the data.
Note: the mass of the tray is 35 g.
Measure the spring constant of the spring by attaching different masses - noting the displacement and fitting this to a straight line.
Content of Report
- Your lab report should include a plot of displacement versus time, and the function which IGOR fit to that data. Show the spring constants you calculated for different masses. Discuss how different masses affect your calculation of the spring constant, and why this may have occured.
- You should also try to simulate this with Interactive Physics. Plot the vertical position of the mass as a function of time. Verify that the mass and spring constant you choose are consistent with the observed frequency.
- Please include your IGOR and Interactive Physics file on your website - so they can be downloaded.
Tips
- When you finish taking your data with Logger Pro, you can export it to a text file. This text file can be loaded into IGOR as a "General Text" format. Do this in IGOR by going to Data -> Load Waves... -> General Text File. Logger Pro writes some header information in the data file before it gets to the columns of numbers; you may need to delete this header information with SimpleText before importing the data into IGOR.
- If IGOR consistently fits a curve with drastically wrong amplitude and frequency to your data, try doing the curve fit over a smaller range initially in "Auto Guess" mode, and then redoing the fit over the whole range in "Manual Guess" mode. The auto and manual guess modes can be varied in the curve fitting dialogue.
- The coefficients for the sinusoidal function IGOR finds are displayed both in a small window that pops up after the fit is completed and in the Command Window.
- IGOR will do a curve fit to a sine function. However, the equation for the displacement versus time of a spring is a cosine function. If this is causing you confusion, just think about how sine and cosine functions are related.
